Week 1 Basics
1.1 Day 1 (Monday) Zoom orientation
1.1.1 Logistics (10 minutes)
Course material
- Available at https://mtmorgan.github.io/QuaRantine
Cadence
- Monday and Friday group zoom sessions – these will review and troubleshoot previous material, and outline goals for the next set of independent activities.
- Daily independent activities – most of your learning will happen here!
Communicating
- We’ll use Microsoft Teams (if most participants have access to the course)
- Visit Microsoft Teams and sign in with your Roswell username (e.g.,
MA38727@RoswellPark.org) and the password you use to check email, etc. Join the ‘QuaRantine’ team.
1.1.2 Installing R and RStudio (25 minutes, Shawn)
![]()
What is R?
A programming language for statistical computing, data analysis and scientific graphics.
Open-source with a large (and growing) user community.
Currently in the top 10 most popular languages according to the tiobe index.
What is RStudio?
- RStudio provides an integrated editor and shell environment to make R programming easier. Some of the more useful features include:
- Syntax highlighting and color coding
- Easy switching between shell and editor
- Dynamic help and docs
Installing R and RStudio
- Two ways to “get” RStudio:
- Install on your laptop or desktop
- Download the free desktop installer here
- Use the rstudio.cloud resource
- Visit rstudio.cloud, sign-up, and sign-on
- Install on your laptop or desktop
The preferred approach for this course is to try to install R and RStudio on your own computer
- Windows Users:
- Download R for Windows and run the installer. Avoid, if possible, installing as administrator.
- Download RStudio for Windows and run the installer.
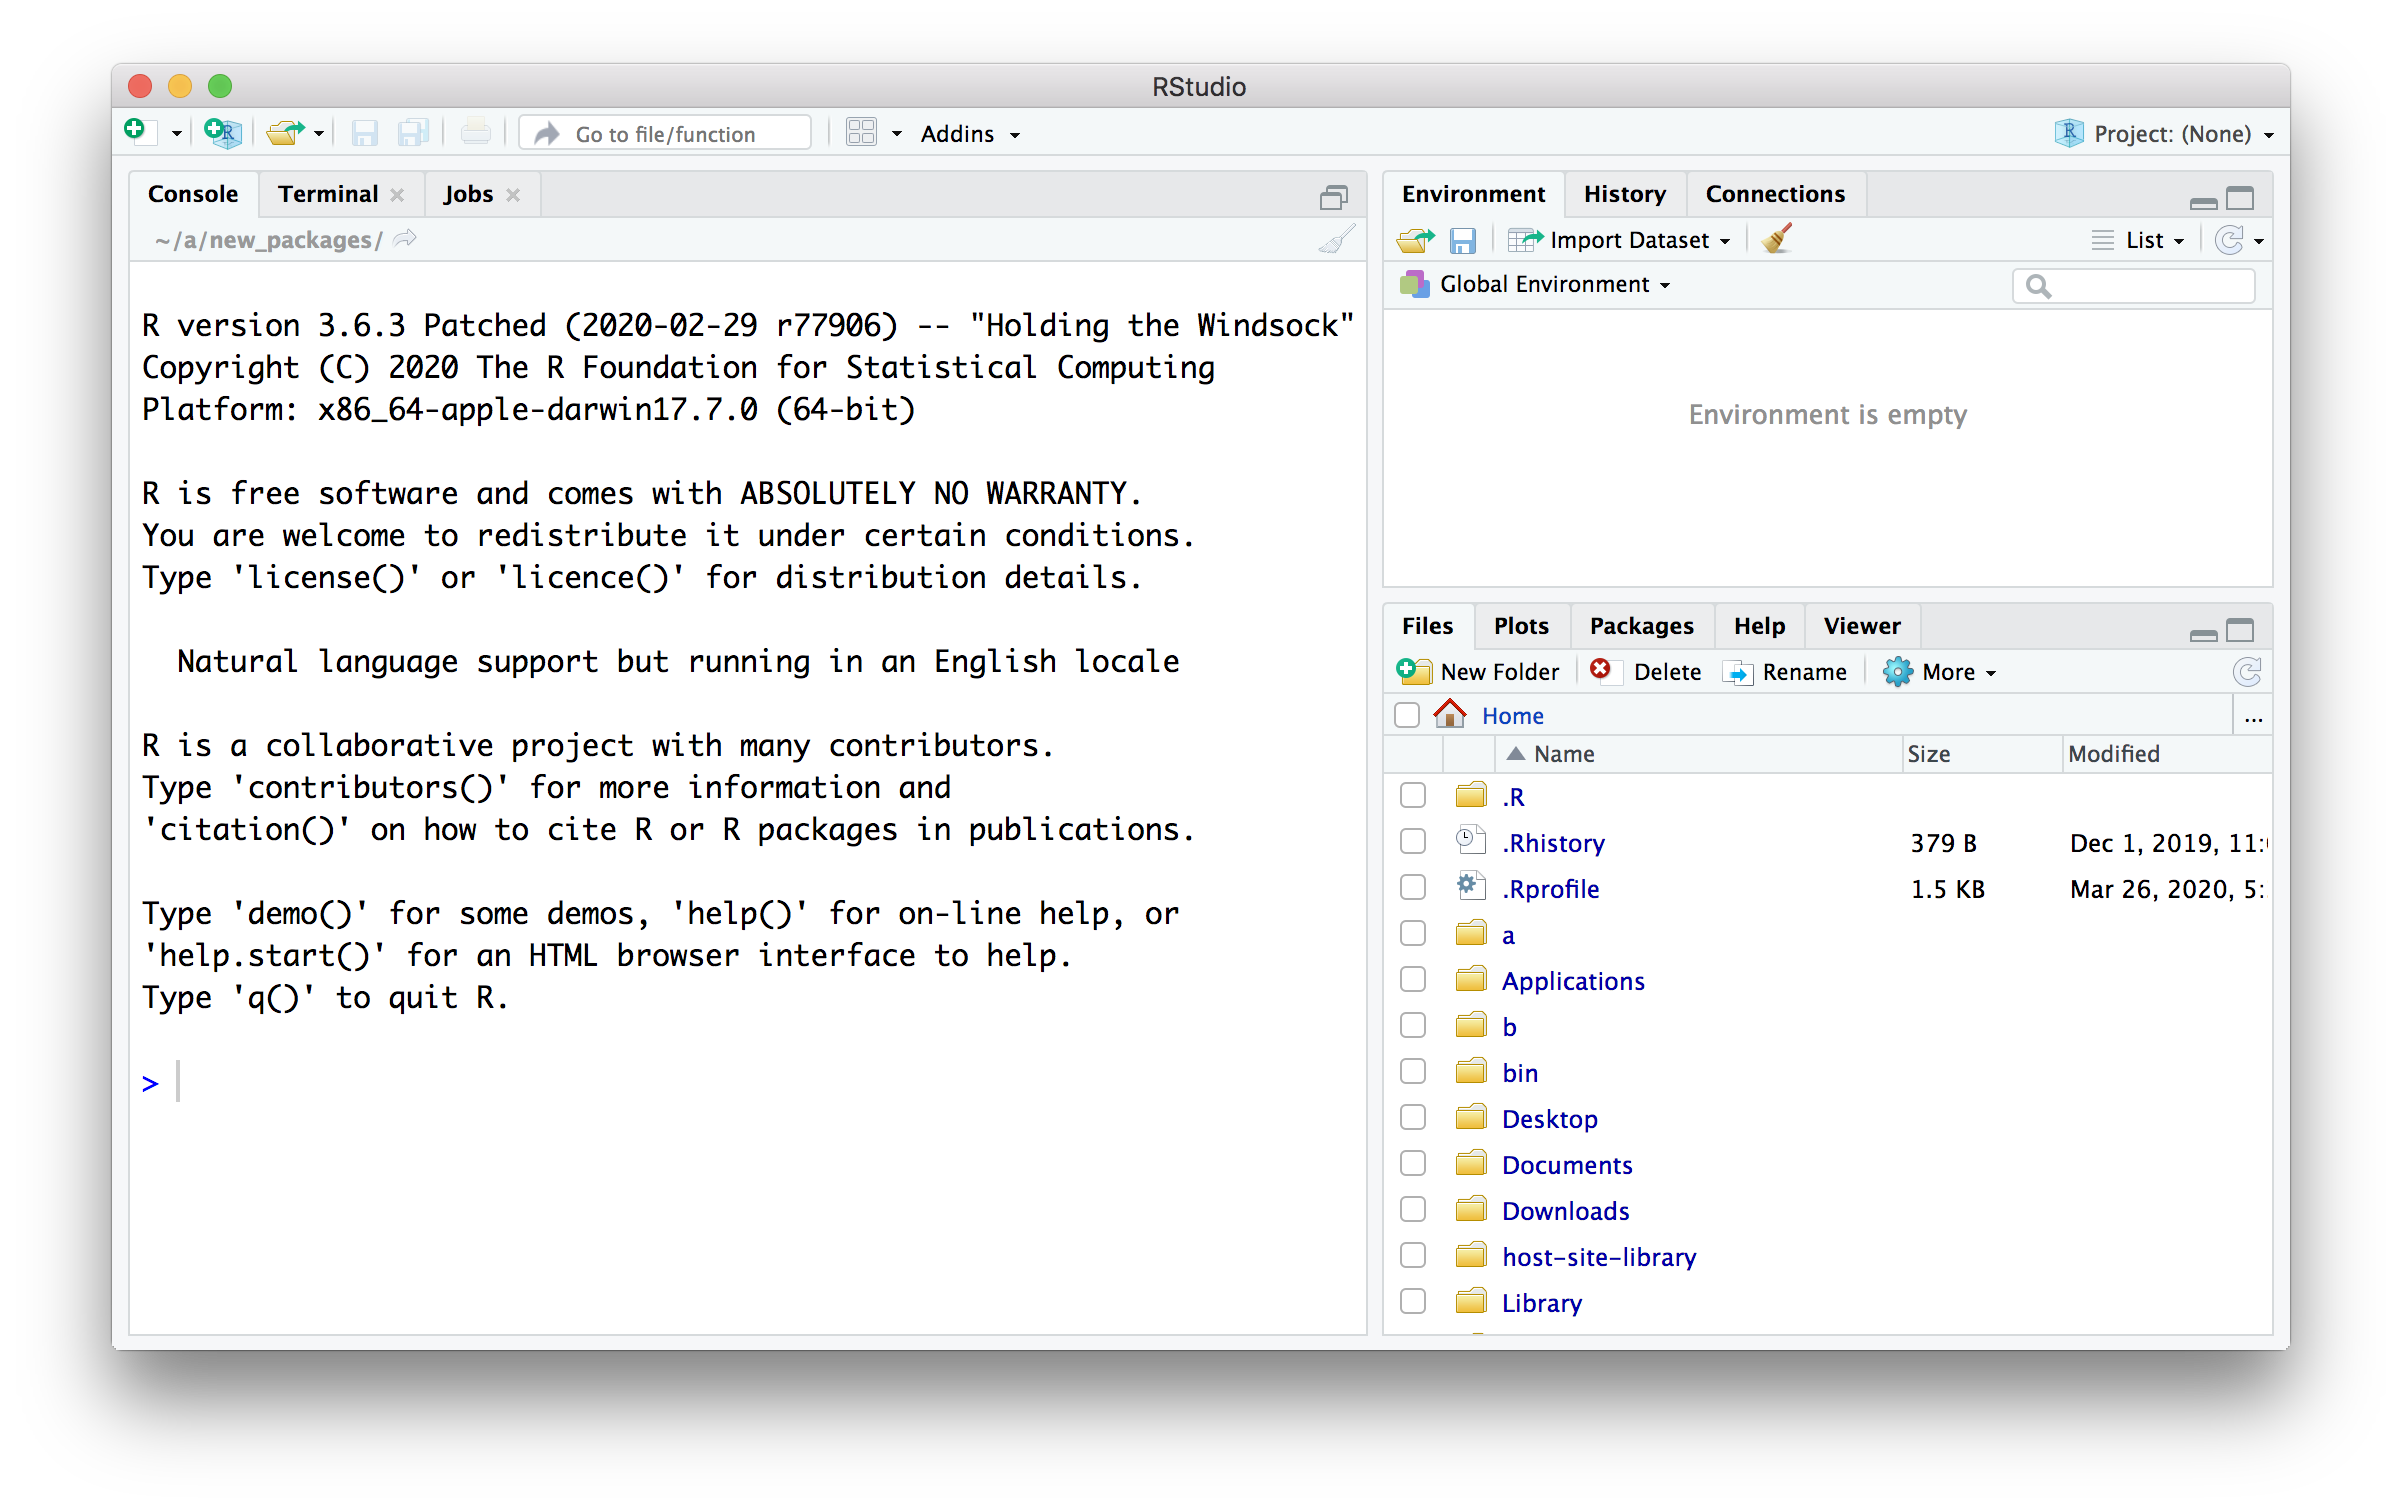
- Test the installation by launching RStudio. You should end up with a window like the screen shot below.
- Mac Users:
- Download R for macOS (OS X 10.11, El Capitan, and later) or older macOS and run the installer.
- Download RStudio for macOS and run the installer.
- Test the installation by launching RStudio. You should end up with a window like the screen shot below.
An ALTERNATIVE, if installing on your own computer does not work:
- Do the following only if you are NOT ABLE TO INSTALL R and RStudio.
Visit rstudio.cloud. Click the ‘Get Started’ button, and create an account (I used my gmail account…). You should end up at a screen like the following.
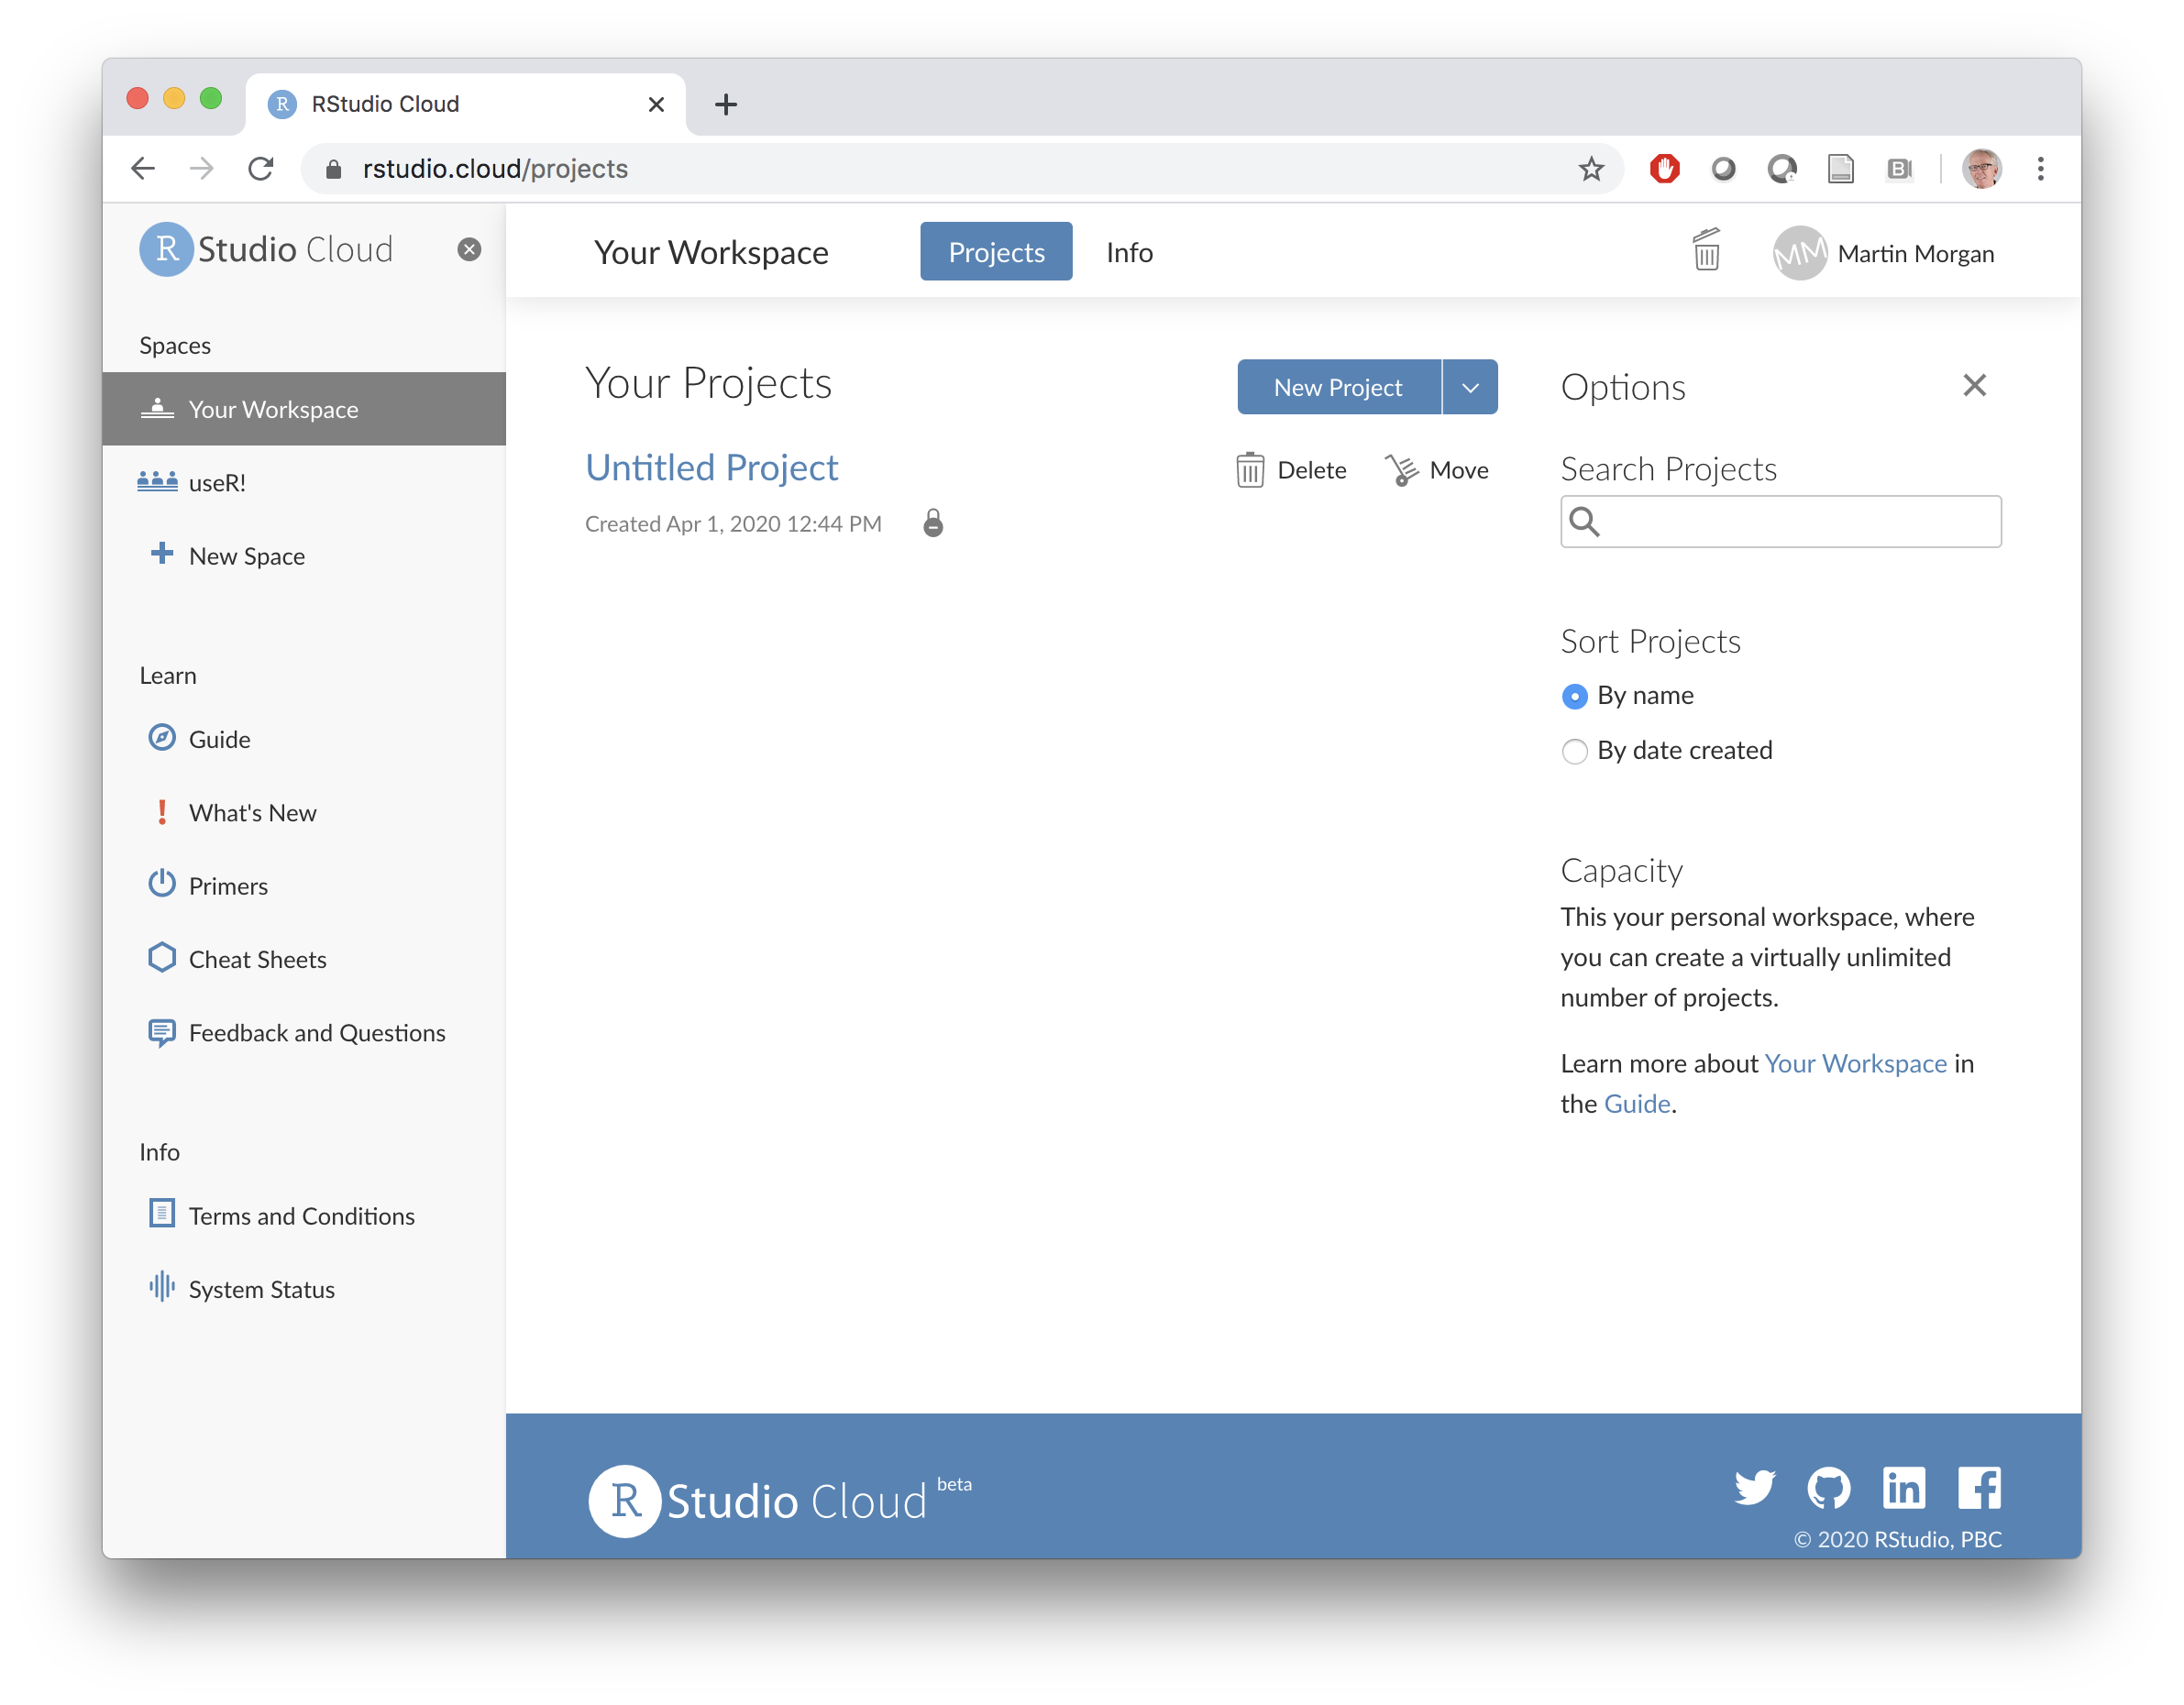
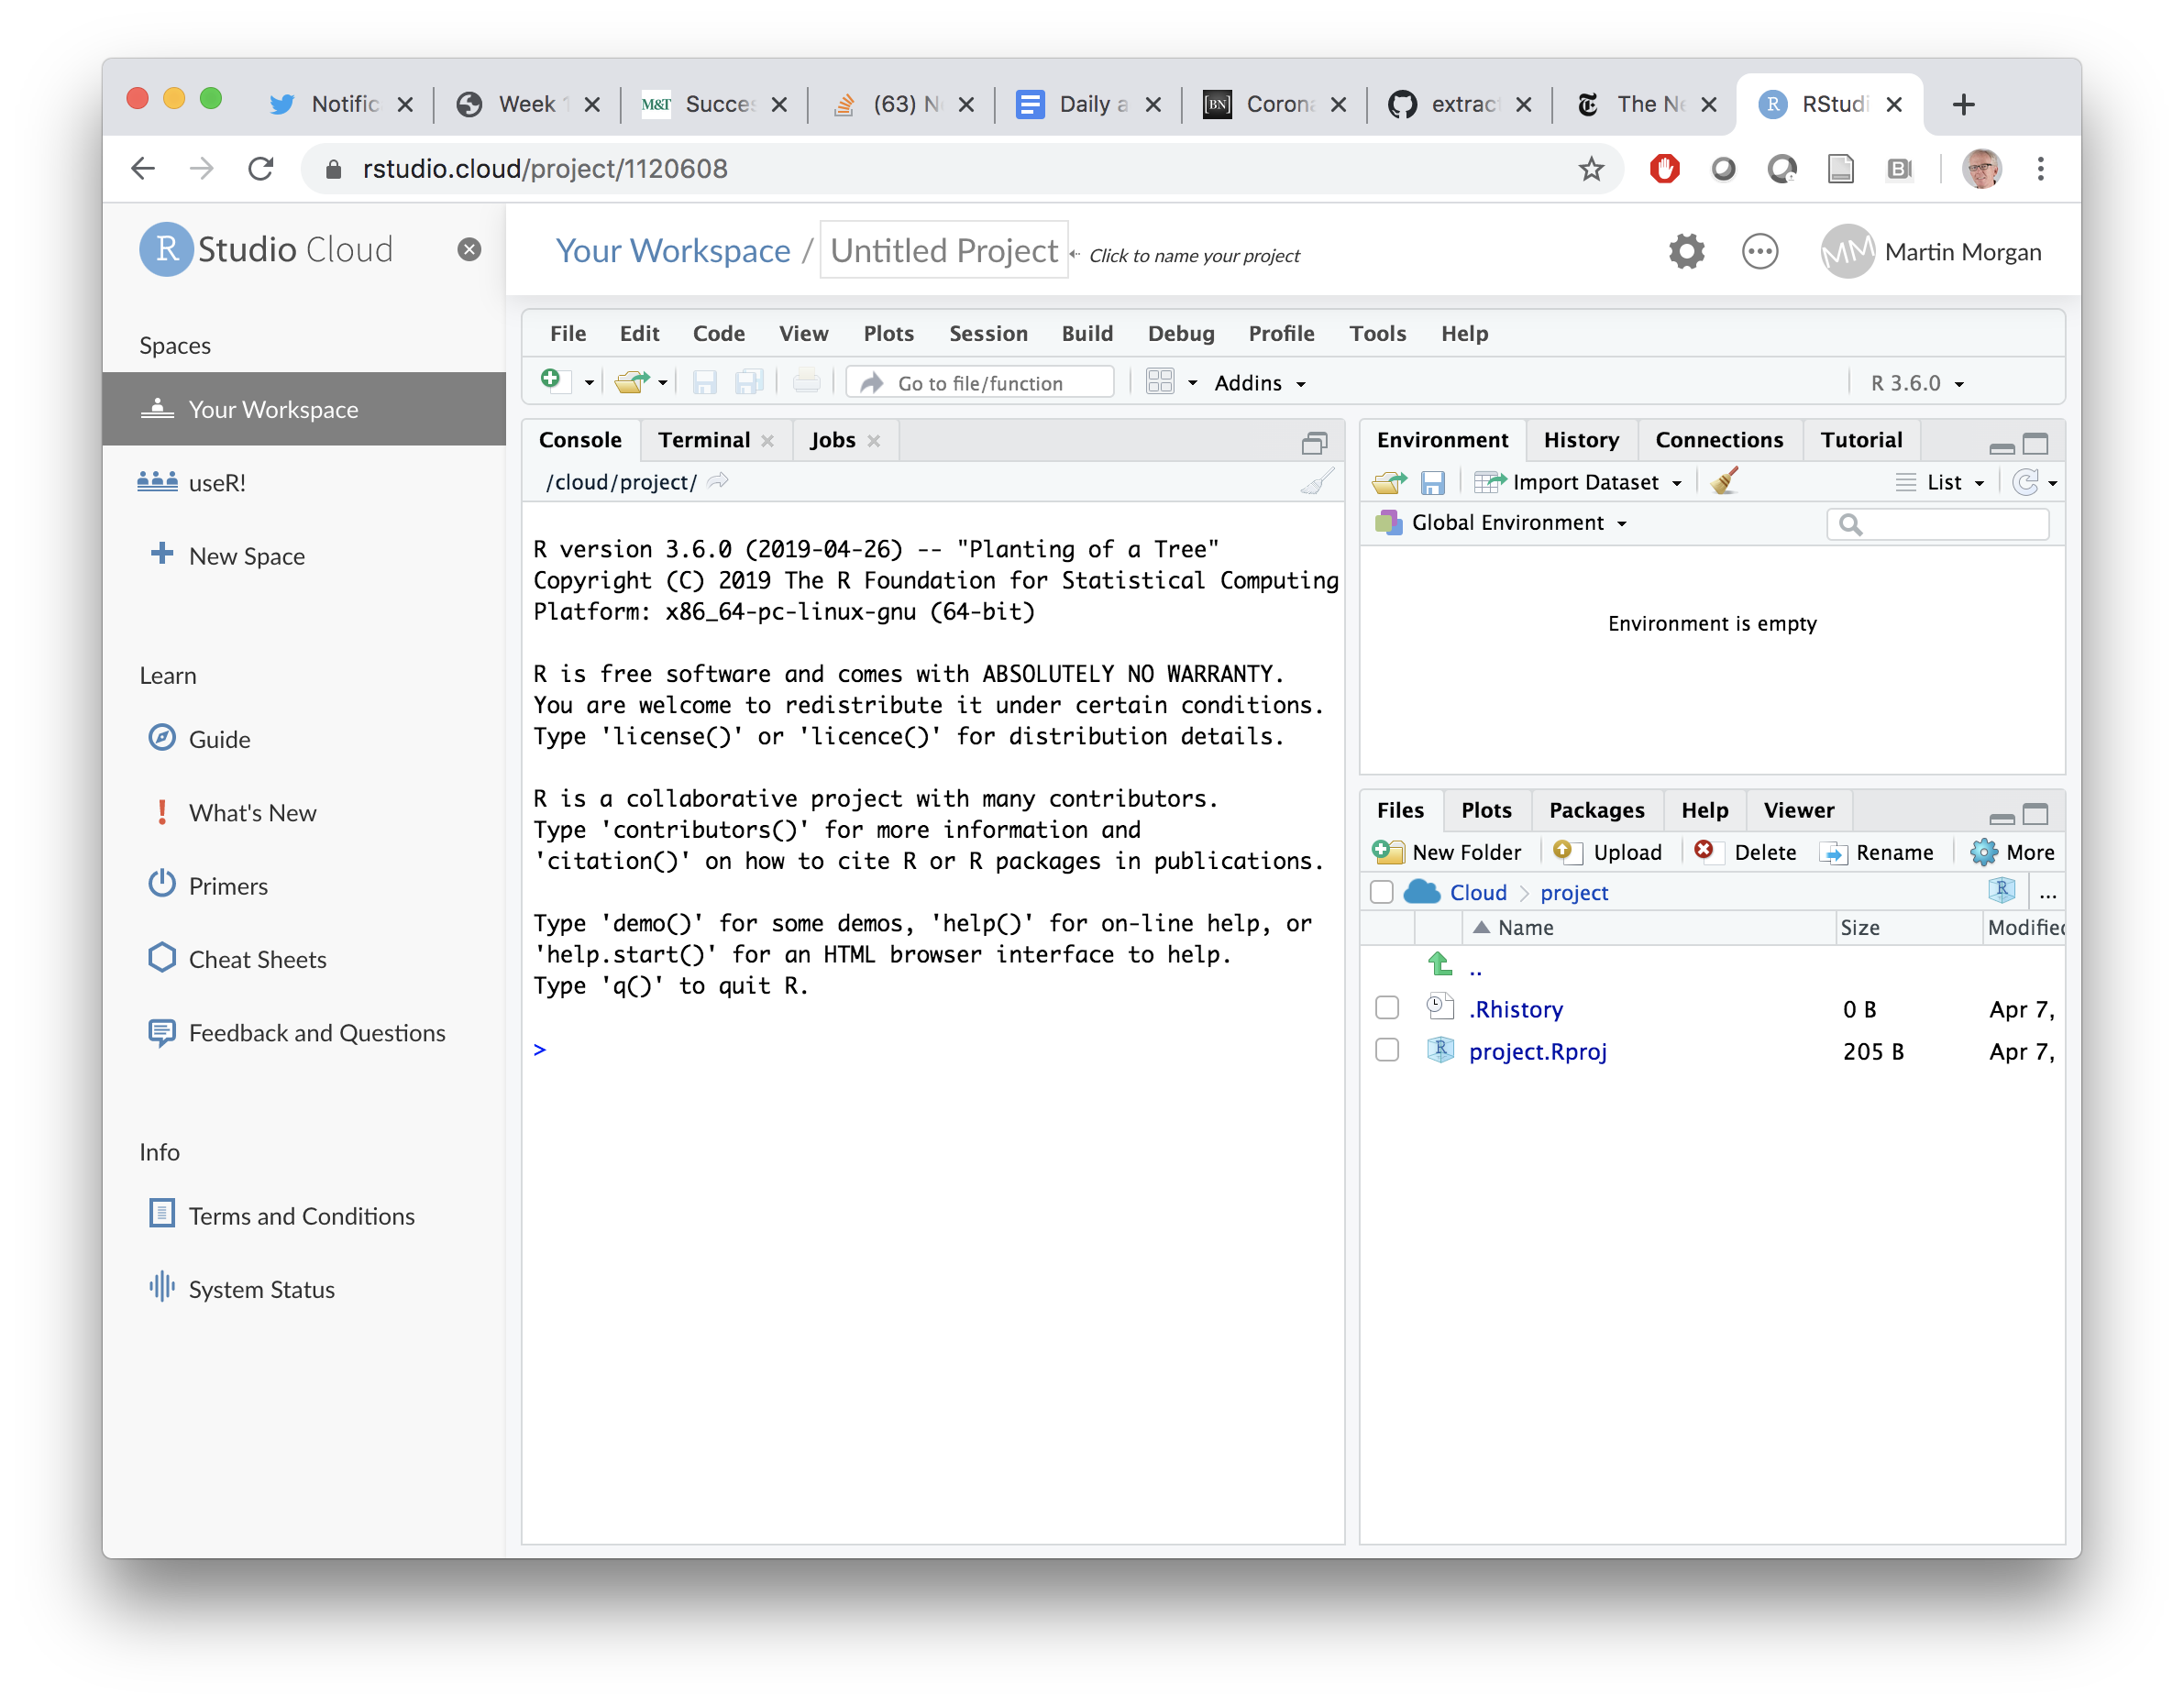
Click on the ‘New Project’ button, to end up with a screen like the one below. Note the ‘Untitled Project’ at the top of the screen; click on it to name your project, e.g., ‘QuaRantine’.

Breakout Room
At this point you should have RStudio running either via your desktop installation or through rstudio.cloud. If not, please let us know via the chat window and we’ll invite you to a breakout room to troubleshoot your installation.
1.1.3 Basics of R (25 minutes)

R Console Output
Enter this in the console:
Q: what’s the [1] all about in the output?
A: It’s the index of the first entry in each line.
This is maybe a better example:
Displaying help in the R Console
? <command-name>
Some examples:
? cat
? print
Variables
Naming variables in R
A variable name can contain letters, numbers, and the dot
.or underline_characters. Variables should start with a letter.Try entering these in the console:
y = 2try.this = 33.3oneMoreTime = "woohoo"Now try these:
2y = 2_z = 33.3function = "oops, my bad"
R is case sensitive (R != r)
Variable Assignment
You may use
=or<-(and even->) to assign values to a variable.
R’s four basic ‘atomic’ data types
- Numeric (includes integer, double, etc.)
3.14,1,2600
- Character (string)
"hey, I'm a string"'single quotes are ok too'
- Logical
TRUEorFALSE(note all caps)
NA- not assigned (no known value)
Use class() to query the class of data:
Use as. to coerce a variable to a specific data type
Using Logical Operators
Equivalence test (==):
Not equal test (!=):
less-than (<) and greater-than (>):
Logical Or (|):
Logical And (&):
Objects and Vectors in R
Objects
- R stores everything, variables included, in ‘objects’.
x <- 2.71

# print the value of an object
print(x)
## [1] 2.71

# determine class or internal type of an object
class(x)
## [1] "numeric"

# TRUE if an object has not been assigned a value
is.na(x)
## [1] FALSE
Vectors
- ‘Vectors’ and ‘data frames’ are the bread and butter of R
- Vectors consist of several elements of the same class
- e.g. a vector of heart rates, one per patient
Data frames (data.frame)
- Data frames are structures that can contain columns of various types
- e.g. height, weight, age, heart rate, etc.
- Handy containers for experimental data
- Analogous to spreadsheet data
- More on Data Frames throughout the week!
Working with Vectors
Creating a Vector
- Use the
c()function
name <- c("John Doe", "Jane Smith", "MacGillicuddy Jones", "Echo Shamus")
age <- c(36, 54, 82, 15)
favorite_color <- c("red", "orange", "green", "black")

## print the vectors
name
## [1] "John Doe"            "Jane Smith"          "MacGillicuddy Jones"
## [4] "Echo Shamus"
age
## [1] 36 54 82 15
favorite_color
## [1] "red"    "orange" "green"  "black"
Accessing vector data
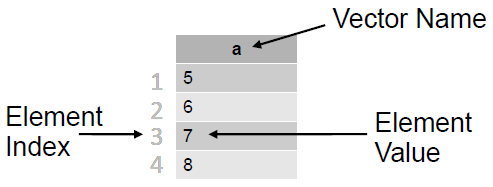
- Use numerical indexing
- R uses 1-based indexing
- 1st vector element has index of 1
- 2nd has an index of 2
- 3rd has an index of 3
- and so on
- R supports “slicing” (i.e. extracting multiple items)
- Negative indices are omitted
Some Useful Vector Operations
length(): number of elementssum(): sum of all element valuesunique(): distinct valuessort(): sort elements, omitting NAsorder(): indices of sorted elements, NAs are lastrev(): reverse the ordersummary(): simple statistics
a <- c(5, 5, 6, 7, 8, 4)
sum(a)
## [1] 35
length(a)
## [1] 6
unique(a)
## [1] 5 6 7 8 4
sort(a)
## [1] 4 5 5 6 7 8
order(a)
## [1] 6 1 2 3 4 5
a[order(a)]
## [1] 4 5 5 6 7 8
rev(a)
## [1] 4 8 7 6 5 5
summary(a)
##    Min. 1st Qu.  Median    Mean 3rd Qu.    Max.
##   4.000   5.000   5.500   5.833   6.750   8.000
Handling Missing Data
- First consider the reason(s) for the missing data
- e.g. concentrations that are below detectable levels?
- Sometimes NAs in data require special statistical methods
- Other times we can safely discard / ignore NA entries
- To remove NAs prior to a calculation:
Wrapping up day 1
The goal for today was to rapidly cover some of the essential aspects of R programming. For the remainder of the week you’ll work at your own pace to get more of a hands-on deep dive into this material. If you run into trouble please don’t hesiate to ask for help via Teams (QuaRantine Team), slack (QuaRantine Course), or email (Drs. Matott and Morgan) — whatever works best for you!
1.2 Day 2: Vectors and variables
Our overall goal for the next few days is to use R to create a daily log of quarantine activities.
Our goal for today is to become familiar with R vectors. Along the way we’ll probably make data entry and other errors that will start to get us comfortable with R.
If you run into problems, reach out to the slack channel for support!
The astronaut Scott Kelly said that to survive a year on the International Space Station he found it essential to
- Follow a schedule – plan your day, and stick to the plan
- Pace yourselves – you’ve got a long time to accomplish tasks, so don’t try to get everything done in the first week.
- Go outside – if Scott can head out to space, we should be able to make it to the back yard or around the block!
- Get a hobby – something not work related, and away from that evil little screen. Maybe it’s as simple as rediscovering the joy of reading.
- Keep a journal
- Take time to connect – on a human level, with people you work with and people you don’t!
- Listen to experts – Scott talked about relying on the mission controllers; for us maybe that’s watching webinars or taking courses in new topics!
- Wash your hands!
I wanted to emphasize ‘follow a schedule’ and ‘keep a journal’. How can R help? Well, I want to create a short record of how I spend today, day 2 of my quarantine.
My first goal is to create vectors describing things I plan to do today. Let’s start with some of these. To get up to speed, type the following into the R console, at the > prompt
Press the carriage return and remind yourself that R is a calculator, and knows how to work with numbers!
Now type an activity in your day, for instance I often start with
Now try assigning that to a variable, and displaying the variable, e.g.,
OK, likely you have several activities scheduled. Create a vector of a few of
these by concatenating individual values
c("check e-mail", "breakfast", "conference call", "webinar", "walk")
## [1] "check e-mail"    "breakfast"       "conference call" "webinar"
## [5] "walk"
Assign these to a variable
activity <- c("check e-mail", "breakfast", "conference call", "webinar", "walk")
activity
## [1] "check e-mail"    "breakfast"       "conference call" "webinar"
## [5] "walk"
Create another vector, but this time the vector should contain the minutes spent on each activity
So I spent 20 minutes checking email, 30 minutes having breakfast and things like that, I was in a conference call for 60 minutes, and then attended a webinar where I learned new stuff for another 60 minutes. Finally I went for a walk to clear my head and remember why I’m doing things.
Apply some basic functions to the variables, e.g., use length() to demonstrate that you for each activity you have recorded the minutes.
Use tail() to select the last two activities (or head() to select the first two…)
R has other types of vectors. Create a logical vector that indicates whether each activity was ‘work’ activity’ or something you did for your own survival. We’ll say that checking email is a work-related activity!
1.3 Day 3: factor(), Date(), and NA
Yesterday we learned about character, numeric, and logical vectors in R (you may need to revisit previous notes and re-create these variables)
activity
## [1] "check e-mail"    "breakfast"       "conference call" "webinar"
## [5] "walk"
minutes
## [1] 20 30 60 60 60
is_work
## [1]  TRUE FALSE  TRUE  TRUE FALSE
Today we will learn about slightly more complicated vectors.
We created the logical vector is_work to classify each activity as either work-related or not. What if we had several different categories? For instance, we might want to classify the activities into categories inspired by astronaut Kelly’s guidance. Categories might include: connect with others; go outside and exercise; consult experts; get a hobby; and (my own category, I guess) perform essential functions like eating and sleeping. So the values of activity could be classified as
I want to emphasize a difference between the activity and classification variables. I want activity to be a character vector that could contain any description of an activity. But I want classification to be terms only from a limited set of possibilities. In R, I want classification to be a special type of vector called a factor, with the values of the vector restricted to a set of possible levels that I define. I create a factor by enumerating the possible levels that the factor can take on
And then tell R that the vector classification should be a factor with values taken from a particular set of levels
classification <- factor(
    c("connect", "essential", "connect", "consult", "exercise"),
    levels = levels
)
classification
## [1] connect   essential connect   consult   exercise
## Levels: connect exercise consult hobby essential
Notice that activity (a character vector) displays differently from classification (a factor)
activity
## [1] "check e-mail"    "breakfast"       "conference call" "webinar"
## [5] "walk"
classification
## [1] connect   essential connect   consult   exercise
## Levels: connect exercise consult hobby essential
Also, some of the levels (e.g., hobby) have not been part of our schedule yet, but the factor still ‘knows’ about the level.
Notice also what happens when I try to use a value (disconnect) that is not a level of a factor
factor(c("connect", "disconnect"), levels = levels)
## [1] connect <NA>
## Levels: connect exercise consult hobby essential
The value with the unknown level is displayed as NA, for ‘not known’. NA values can be present in any vector, e.g.,
c(1, 2, NA, 4)
## [1]  1  2 NA  4
c("walk", "talk", NA)
## [1] "walk" "talk" NA
c(NA, TRUE, FALSE, TRUE, TRUE)
## [1]    NA  TRUE FALSE  TRUE  TRUE
This serves as an indication that the value is simply not available. Use NA rather than adopting some special code (e.g., ‘-99’) to indicate when a value is not available.
One other type of vector we will work a lot with are dates. All of my activities are for today, so I’ll start with a character vector with the same length as my activity vector, each indicating the date in a consistent month-day-year format
dates <- c("04-14-2020", "04-14-2020", "04-14-2020", "04-14-2020", "04-14-2020")
dates
## [1] "04-14-2020" "04-14-2020" "04-14-2020" "04-14-2020" "04-14-2020"
Incidentally, I could do this more efficiently using the replicate function
And even better use length() to know for sure how many times I should replicate the character vector
rep("04-14-2020", length(activity))
## [1] "04-14-2020" "04-14-2020" "04-14-2020" "04-14-2020" "04-14-2020"
dates is a character vector, but it has specially meaning as a calendar date, R has a Date class that knows how to work with dates, for instance to calculate the number of days between two dates. We will coerce date to an object of class Date using a function as.Date. Here’s our first attempt…
… but this results in an error:
Error in charToDate(x) :
  character string is not in a standard unambiguous format
R doesn’t know the format (month-day-year) of the dates we provide. The solution is to add a second argument to as.Date(). The second argument is a character vector that describes the date format. The format we use is "%m-%d-%Y", which says that we provide the %month first, then a hyphen, then the %day, another hyphen, and finally the four-digit %Year.
as.Date(dates, format = "%m-%d-%Y")
## [1] "2020-04-14" "2020-04-14" "2020-04-14" "2020-04-14" "2020-04-14"
Notice that the format has been standardized to year-month-day. Also notice that although the original value of date and the return from as.Data() look the same, they are actually of different class.
R will use the information about class to enable specialized calculation on dates, e.g., to sort them or to determine the number of days between different dates. So here’s our date vector as a Date object.
dates <- rep("04-14-2020", length(activity))
date <- as.Date(dates, format = "%m-%d-%Y")
date
## [1] "2020-04-14" "2020-04-14" "2020-04-14" "2020-04-14" "2020-04-14"
OK, time for a walk! See you tomorrow!
1.4 Day 4: Working with variables
Remember that R can act as a simple calculator, and that one can create new variables by assignment
Let’s apply these ideaas to our minutes vector from earlier in the week.
We can perform basic arithmetic on vectors. Suppose we wanted to increase the time of each activity by 5 minutes
or to increase the time of the first two activities by 5 minutes, and the last three activities by 10 minutes
R has a very large number of functions that can be used on vectors. For instance, the average time spent on activities is
while the total amount of time is
Explore other typical mathematical transformations, e.g., log(), log10(), sqrt() (square root), … Check out the help pages for each, e.g., ?log.
Explore the consequences of NA in a vector for functions like mean() and sum().
R is saying that, since there is an unknown (NA) value in the vector, it cannot possibly know what the mean is! Tell R to remove the missing values before performing the calculation by adding the na.rm = TRUE argument
Check out the help page ?mean to find a description of the na.rm and other arguments.
It’s possible to perform logical operations on vectors, e.g., to ask which activities lasted 60 minutes or more
Here’s our activity vector
The elements of this vector are numbered from 1 to 5. We can create a new vector that is a subset of this vector using [ and an integer index, e.g., the second activity is
The index can actually be a vector, so we could choose the second and fourth activity as
In fact, we can use logical vectors for subsetting. Consider the activities that take sixty minutes or longer:
We had previously characterized the activities as ‘work’ or otherwise.
Use is_work to subset activity and identify the work-related activities
How many minutes were work-related?
What about not work related? ! negates logical vectors, so
is_work
## [1] TRUE FALSE TRUE TRUE FALSE
!is_work
## [1] FALSE TRUE FALSE FALSE TRUE
non_work_minutes <- minutes[!is_work]
sum(non_work_minutes)
## [1] 90Note that it doesn’t make sense to take the mean() of a character vector like activity, and R signals a warning and returns NA
mean(activity)
## Warning in mean.default(activity): argument is not numeric or logical: returning
## NA
## [1] NANonetheless, there are many functions that do work on character vectors, e.g., the number of letters in each element nchar(), or transformation to upper-case
1.5 Day 5 (Friday) Zoom check-in
1.5.1 Logistics
- Please join Microsoft Teams! Need help? Contact Adam.Kisailus at RoswellPark.org.
1.5.2 Review and trouble shoot (25 minutes; Martin)
Data representations
‘Atomic’ vectors
activity <- c("check e-mail", "breakfast", "conference call", "webinar", "walk")
minutes <- c(20, 30, 60, 60, 60)
is_work <- c(TRUE, FALSE, TRUE, TRUE, FALSE)factor() and date()
levels <- c("connect", "exercise", "consult", "hobby", "essential")
classification <- factor(
c("connect", "essential", "connect", "consult", "exercise"),
levels = levels
)
dates <- rep("04-14-2020", length(activity))
date <- as.Date(dates, format = "%m-%d-%Y")Missing values
x <- c(1, 3, NA, 5)
sum(x)
## [1] NA
sum(x, na.rm = TRUE)
## [1] 9
factor(c("connect", "disconnect"), levels = levels)
## [1] connect <NA>
## Levels: connect exercise consult hobby essentialFunctions and logical operators
x <- c(1, 3, NA, 5)
sum(x)
## [1] NA
sum(x, na.rm = TRUE)
## [1] 9
minutes >= 60
## [1] FALSE FALSE TRUE TRUE TRUESubsetting vectors
1-basaed numeric indexes
logical index
Maybe more interesting…
Other fun topics
%in%: a binary operator
is each of the vector elements on the left-hand side in the set of elements on the right hand side
named vectors (see Annual Estimates… table from census.gov)
Define a named vector
state_populations <- c( Alabama = 4903185, Alaska = 731545, Arizona = 7278717, Arkansas = 3017804, California = 39512223, Colorado = 5758736, Connecticut = 3565287, Delaware = 973764, `District of Columbia` = 705749, Florida = 21477737, Georgia = 10617423, Hawaii = 1415872, Idaho = 1787065, Illinois = 12671821, Indiana = 6732219, Iowa = 3155070, Kansas = 2913314, Kentucky = 4467673, Louisiana = 4648794, Maine = 1344212, Maryland = 6045680, Massachusetts = 6892503, Michigan = 9986857, Minnesota = 5639632, Mississippi = 2976149, Missouri = 6137428, Montana = 1068778, Nebraska = 1934408, Nevada = 3080156, `New Hampshire` = 1359711, `New Jersey` = 8882190, `New Mexico` = 2096829, `New York` = 19453561, `North Carolina` = 10488084, `North Dakota` = 762062, Ohio = 11689100, Oklahoma = 3956971, Oregon = 4217737, Pennsylvania = 12801989, `Rhode Island` = 1059361, `South Carolina` = 5148714, `South Dakota` = 884659, Tennessee = 6829174, Texas = 28995881, Utah = 3205958, Vermont = 623989, Virginia = 8535519, Washington = 7614893, `West Virginia` = 1792147, Wisconsin = 5822434, Wyoming = 578759 )Computations on named vectors
## US population sum(state_populations) ## [1] 328239523 ## smallest states head(sort(state_populations)) ## Wyoming Vermont District of Columbia ## 578759 623989 705749 ## Alaska North Dakota South Dakota ## 731545 762062 884659 ## largest states head(sort(state_populations, decreasing = TRUE)) ## California Texas Florida New York Pennsylvania Illinois ## 39512223 28995881 21477737 19453561 12801989 12671821 ## states with more than 10 million people big <- state_populations[state_populations > 10000000] big ## California Florida Georgia Illinois New York ## 39512223 21477737 10617423 12671821 19453561 ## North Carolina Ohio Pennsylvania Texas ## 10488084 11689100 12801989 28995881 names(big) ## [1] "California" "Florida" "Georgia" "Illinois" ## [5] "New York" "North Carolina" "Ohio" "Pennsylvania" ## [9] "Texas"Subset by name
1.5.3 Weekend activities (25 minutes; Shawn)
Writing R scripts
R scripts are convenient text files that we can use to save one or more lines of R syntax. Over the weekend you will get some experience working with R scripts. The example below will help you be a bit more prepared.
- In RStudio, click
File --> New File --> R Scriptto create a new script file and open it in the editor.
If you’ve followed the daily coding activities throughout the week, you should have some R code that keeps track of your daily activities.
If so, enter that code into your R script now.
- Otherwise, feel free to use the code below. Look for a
copy to clipboardicon in the top-right of the code block. To copy the code block to your R script:- Click on the
copy to clipboardicon - Place your cursor in your R script
- Click
Edit --> Paste:
- Click on the
## ====================================================================
## day 1 information
## ====================================================================
day1_activity = c("breakfast",
"check e-mail",
"projects",
"conference call",
"teams meeting",
"lunch",
"conference call",
"webinar")
day1_is_work = c(FALSE,TRUE,TRUE,TRUE,TRUE,FALSE,TRUE,TRUE)
day1_minutes = c(30, 75, 120, 30, 60, 30, 60, 120)
n = length(day1_activity)
day1_total_hours = sum(day1_minutes) / 60
day1_work_hours = sum(day1_minutes[day1_is_work == TRUE]) / 60
cat("Total time recorded for day 1 : ", day1_total_hours,
"hours, over", n, "activities\n")
cat("Total time working for day 1 : ", day1_work_hours, "hours \n\n")Recall the discussion of factors and levels in Day 3; the code below leverages this but adds another level named independent work.
If you’ve already got code to assign factors and levels to your daily activity, enter that code into your R script now.
Otherwise, feel free to use the code below via the
copy to clipboardprocedure outlined above:
## ====================================================================
## Kelly, Morgan, and Matott's classification strategy
## ====================================================================
kmm_levels = c("connect",
"exercise",
"consult",
"hobby",
"essential",
"independent work")
## manually map day 1 activity to appropriate kmm_levels
day1_classes = factor(
c("essential", "connect", "independent work",
"connect", "connect", "essential",
"connect", "consult"),
levels = kmm_levels
)On day 3 you also got some experience working with dates. The code below stamps our day 1 activity data with an appropriately formatted date.
If you’ve already got code to assign dates your daily activity, enter that code into your R script now.
Otherwise, feel free to use the code below via the
copy to clipboardprocedure outlined above:
[OPTIONAL ADVANCED MATERIAL]
Earlier today Dr. Morgan touched on named vectors. We can leverage named vectors to create a more general mapping between activities and levels. The code for this is given below. Try it and compare the result to your manual mapping!
## kmm_map is a named vector that maps activities to categories
kmm_map = c("breakfast" = "essential",
"check e-mail" = "connect",
"projects" = "independent work",
"requests" = "independent work",
"conference call" = "connect",
"teams meeting" = "connect",
"lunch" = "essential",
"webinar" = "consult",
"walk" = "exercise")
day1_classes = factor(kmm_map[day1_activity], levels = kmm_levels)Saving R scripts
If you’ve been following along you should now have an R script that contains a bunch of code for keeping track of your daily activity log. Let’s save this file:
- In RStudio, place your cursor anywhere in the script file
- click
File --> Save(or pressCTRL+S)- Name your file something like
daily_activity.R.
- Name your file something like
Running R scripts
Now that we’ve created an R script you may be wondering “How do I run the code in the script?” There’s actually a few ways to do this:
Option #1 (Run)
- Highlight the first block of the code (e.g the part where you recorded day 1 activity and maybe calculated amount of time worked).
- Click the
--> Runicon in the top-right portion of the script editor window.- This will run the highlighted block of code. The output will appear in the RStudio console window along with an echo of the code itself.
Option #2 (Source)
- Click on the
--> Sourceicon just to the right of the--> Runicon. - This will run the entire script.
Equivalent to entering into the console
Only the output generated by
print()andcat()will appear in the RStudio console (i.e. the code in the script is not echoed to the console).
Option #3 (Source with Echo)
- Click on the downward pointing arrowhead next to the source buton to open a dropdown menu
- In the dropdown menu, sectect
Source with Echo - This will run the entire script and the code in the script will be echoed to the RStudio console along with any output generated by
print()andcat(). - The echoed source and the normal output are not color-coded like they are when using the
--> Runbutton. Equivalent to running
Saving data
It can be useful to save objects created in an R script as a data file. These data files can be loaded or re-loaded into a new or existing R session.
For example, let’s suppose you had an R script that mined a trove of Twitter feeds for sentiment data related to government responses to COVID-19. Suppose you ran the script for serveral weeks and collected lot’s of valuable data into a bunch of vectors. Even though the R code is saved as a script file, the data that the script is collecting would be lost once script stops running. Furthermore, due to the temporal nature of Twitter feeds, you wouldn’t be able to collect the same data by simply re-running the script. Luckily, R provides several routines for saving and loading objects. Placing the appropriate code in your R script will ensure that your data is preserved even after the script stops running.
Saving individual R objects
R supports storing a single R object as an .rds file. For example, the code below saves the day1_activity vector to an .rds file. The saveRDS() function is the workhorse in this case and the setwd(), getwd(), and file.path() commands allow us to conveniently specify a name and location for the data file:
## ====================================================================
## creating .rds data files (for saving individual objects)
## ====================================================================
setwd("C:/Matott/MyQuarantine")
my_rds_file = file.path(getwd(), "day1_activity.rds")
my_rds_file # print value -- sanity check
saveRDS(day1_activity, my_rds_file)Loading individual R objects
The complement to the saveRDS() function is the readRDS() function. It loads the R object stored in the specified file. In the example below a data file is loaded and stored as an object named day1_activity_loaded. Compare this object to the existing day1_activity object - they should be the same!
## ====================================================================
## Reading .rds data files (for loading individual objects)
## ====================================================================
setwd("C:/Matott/MyQuarantine")
my_rds_file = file.path(getwd() ,"day1_activity.rds")
my_rds_file
day1_activity_loaded = readRDS(my_rds_file) # now load from diskSaving multiple R objects
The save() function will save one or more objects into a .Rdata file (these are also known as session files). The example below saves various day1 and related factor-level objects to an .Rdata file.
## ====================================================================
## creating .RData files (for saving multiple objects)
## ====================================================================
setwd("C:/Matott/MyQuarantine")
my_rdata_file = file.path(getwd(), "day1.rdata")
save(kmm_levels, kmm_map,
day1_activity, day1_classes, day1_dates, day1_is_work,
day1_minutes, day1_total_hours, day1_work_hours,
file = my_rdata_file)If you have many objects that you want to save, listing them all can be tedious. Fortunately, the ls() command provides a list of all objects in the current R session. The results of ls() can be passed along to the save() command and this will result in all objects being saved. An example of the required syntax is given below.
Loading multiple R objects
The complement to the save() function is the load() function. This will load all objects stored in an .Rdata file into the current R session. Example syntax is given below:
## ====================================================================
## Reading .RData files (for loading multiple objects)
## ====================================================================
setwd("C:/Matott/MyQuarantine")
my_rdata_file = file.path(getwd(), "daily_activity.rdata")
load(my_rdata_file) # reloadIt is also possible to load an .Rdata file using the RStudio interface.
- Click
Session --> Load Workspace ... - A file browser dialog will open
- Navigate to the .rdata file and select
Wrapping up day 5
Today we reviewed the concepts that you worked with throughout the week during your independent activity. We also troubleshooted any problems or questions that may have come up during this time. Finally, we previewed the creation and use of R scripts and learned about saving and loading objects. Over the weekend you will gain some more experience with these topics.
1.6 Day 6: R scripts
Some of you may have already started saving your R commands as script files. As the material gets more complicated (and more interesting) everyone will want to start doing this. Here is an example to get you started:
- Recall that we can create a script file in RStudio, click “File –> New File –> R Script” to create a new script file and open it in the editor
- By convention, R scripts have a .R exstension (e.g. my_script.R)
- In RStudio, click into your untitled script and click “File –> Save”
- Name your file something fun like
my_first_script.Rand save it
- Use the
#character for comments. Enter the following into your R Script file:
- Enter each command on a separate line. It’s also possible to enter multiple (short!) commands on a single line, separated by a semi-colon
;
- Use the “Run” button in RStudio to run the highlighted portion of an R script file. Try this on your simple R Script.

x = "Hello world!"; y = 'Today is'; d = format(Sys.Date(),"%b %d, %Y")
cat(x, y, d, "\n")
## Hello world! Today is May 22, 2020- Alternatively, use “Run –> Run All” to run an entire script file.
For today’s exercise, create a script file that summarizes your quarantine activities over several days. Use comments, white space (blank lines and spaces), and variable names to summarize each day. Here’s what I’ve got…
## 'classification' factor levels
levels <- c("connect", "exercise", "consult", "hobby", "essential")
## Quarantine log, day 1
activity_day_1 <-
c("check e-mail", "breakfast", "conference call", "webinar", "walk")
minutes_day_1 <- c(20, 30, 60, 60, 60)
is_work_day_1 <- c(TRUE, FALSE, TRUE, TRUE, FALSE)
classification_day_1 <- factor(
c("connect", "essential", "connect", "consult", "exercise"),
levels = levels
)
date_day_1 <- as.Date(rep("04-14-2020", length(activity_day_1)), "%m-%d-%Y")
## Quarantine log, day 2
activity_day_2 <-
c("check e-mail", "breakfast", "conference call", "webinar", "read a book")
minutes_day_2 <- c(20, 30, 60, 60, 60)
is_work_day_2 <- c(TRUE, FALSE, TRUE, TRUE, FALSE)
classification_day_2 <- factor(
c("connect", "essential", "connect", "consult", "hobby"),
levels = levels
)
date_day_2 <- as.Date(rep("04-15-2020", length(activity_day_2)), "%m-%d-%Y")
## Quarantine log, day 3
activity_day_3 <-
c("check e-mail", "breakfast", "webinar", "read a book")
minutes_day_3 <- c(20, 30, 60, 60)
is_work_day_3 <- c(TRUE, FALSE, TRUE, FALSE)
classification_day_3 <- factor(
c("connect", "essential", "connect", "consult", "hobby"),
levels = levels
)
date_day_3 <- as.Date(rep("04-16-2020", length(activity_day_3)), "%m-%d-%Y")Try concatenating these values, e.g.,
activity <- c(activity_day_1, activity_day_2, activity_day_3)
activity
## [1] "check e-mail" "breakfast" "conference call" "webinar"
## [5] "walk" "check e-mail" "breakfast" "conference call"
## [9] "webinar" "read a book" "check e-mail" "breakfast"
## [13] "webinar" "read a book"Save your script, quit R and RStudio, and restart R. Re-open and run the script to re-do your original work.
Think about how this makes your work reproducible from one day to the next, and how making your scientific work reproducible would be advantageous.
1.7 Day 7: Saving data
We’ve defined these variables
activity <- c("check e-mail", "breakfast", "conference call", "webinar", "walk")
minutes <- c(20, 30, 60, 60, 60)
is_work <- c(TRUE, FALSE, TRUE, TRUE, FALSE)
levels <- c("connect", "exercise", "consult", "hobby", "essential")
classification <- factor(
    c("connect", "essential", "connect", "consult", "exercise"),
    levels = levels
)

dates <- rep("04-14-2020", length(activity))
date <- as.Date(dates, format = "%m-%d-%Y")Individual variables can be saved to a file.
Define the path to the file. The file extension is, by convention, ‘.rds’. We’ll use a temporary location
…but we could have chosen the destination interactively
…or provided path relative to the ‘current working directory’, or an absolute file path (use ‘/’ to specify paths on all operating systems, including Windows)
use
saveRDS()to save a single object to a fileuse
readRDS()to read the object back in
Use save() and load() to save and load several objects.
Use
.RDaataas the file extension.Usually we would NOT save to a temporary location, because the temporary location would be deleted when we ended our R session.Remove the objects from the R session, and verify that they are absent
Load the saved objects
As an exercise…
Chose a location to save your data, e.g., in the current working direcotry
Save the data
Now the moment of truth. Quit R without saving your workspace
Start a new session of R, and verify that your objects are not present
Create a path to the saved data file
Load the data and verify that it is correct
load(my_file_path)
activity
## [1] "check e-mail"    "breakfast"       "conference call" "webinar"
## [5] "walk"
minutes
## [1] 20 30 60 60 60
is_work
## [1]  TRUE FALSE  TRUE  TRUE FALSE
date
## [1] "2020-04-14" "2020-04-14" "2020-04-14" "2020-04-14" "2020-04-14"
classification
## [1] connect   essential connect   consult   exercise
## Levels: connect exercise consult hobby essential
See you in zoom on Monday!